
TV18 Broadcast Ltd has been attracting more attention in the stock market due to volatility in its share price as it signifies the changing investor sentiment towards the media and broadcasting industry. TV18 being a major constituent of the Network18 family has its stock market performance closely monitored by market players interested in advertising trends, use of news and development of digital media in India. The share price movement of the company reflects both the opportunities as well as challenges the news broadcasters are undergoing in the fast-changing media landscape. This article report will discuss its TV18 Share Price, business model, financial statements, peer analysis, risks and outlook.
TV18 Broadcast Company Overview
TV18 Broadcast Ltd deals with broadcasting of news, digital content and related media related businesses. The company is owned by the Network18 brand and runs an extensive range of news stations in English, Hindi, business news and in the regional languages. It has a wide network and this is an excellent competitive advantage since it has a huge reach and brand recognition. It is also the company that operates the largest news network in India, and has several business news channels, national general news channels, and over a dozen regional news channels. Such diversified content will enable TV18 to address a wide audience base both in terms of demographics and geography.
| Particular | Details |
| Company Name | TV18 Broadcast Limited |
| Industry | Media & Entertainment |
| Segment | TV Broadcasting & Digital Media |
| Parent Company | Network18 Media & Investments Ltd |
| Listed On | NSE |
| Market Capitalization | ₹7,761 Cr |
| Face Value | ₹2 |
| Book Value | ₹99.9 |
| Dividend Yield | 0.00% |
| ROCE | 0.12% |
| ROE | -0.45% |
TV18 Business Model and Operations
TV18 has major sources of revenue such as advertising revenues, content syndication and digital revenues. The company is sensitive to economic cycles and patterns of demand in advertising as the largest contribution is advertising. The firm also puts huge investments in content development, technology, and newsroom infrastructure to sustain editorial leadership.
As the trend of moving to the digital media has increased, TV18 has proliferated its presence in websites, mobile applications, and social networking platforms. In the last couple of years, however, high operating costs, stiff competition and changes in ad revenues have hit the margins.
TV18 Current Share Price Performance
TV18 Broadcast Ltd listed at 37.21 on the NSE on January 2026, which is a depreciation of 1.09 percent compared to the last close of 37.62. The stock started the day higher at 37.86, but it experienced selling pressure within the day and slightly approached its intraday low. This motion recommends prudent mood in investors in the presence of larger market and industry-specific hazards. Trading volumes are also quite good, irrespective of the dip, which suggests that traders and short-term participants are also interested. Weak earnings visibility and depressed fundamentals have left long-term investors on the alert.
| Metric | Value |
| Current Price | ₹37.21 |
| Day Change | -1.09% |
| Price Change | -₹0.41 |
| Opening Price | ₹37.86 |
| Day High | ₹38.02 |
| Day Low | ₹36.79 |
| Volume | ~4.17 million shares |
TV18 Business & Market Valuation
TV18 Broadcast is estimated to have a market capitalization of approximately ₹57,378 crore at the present price but as the values are determined differently across the platforms owing to timing and consolidation. The company is currently at a relatively high P/E ratio of 37.21, which is high according to the recent losses and poor returns ratios experienced by the company. It is also trading significantly below its important moving averages, which portrays the continued bearish momentum. Such an underperformance gap is a sign of a long-term shortcoming and low expectations of recovering soon.
| Indicator | Value |
| Market Capitalization | ~₹57,378 Cr |
| P/E Ratio | 37.21 |
| EPS | ₹1.00 |
| 50-Day Moving Average | ₹43.41 |
| 200-Day Moving Average | ₹50.25 |
TV18 Share price NSE Live Trading Status
TV18 is currently floating around NSE at 37 levels, and testing significant support areas. The volume of trading is much greater than the average recent, which indicates active trading in spite of the decreasing trend. High volume on declines may be a sign of distribution and not accumulation.
The failure of the stock to recover the lost grounds is an indication that market participants are yet to be convinced of a lasting fundamental recovery.
| Particular | Value |
|---|---|
| Current NSE Price | ₹37.21 |
| Day’s High / Low | ₹38.02 / ₹36.79 |
| Today’s Volume | ~4.17 million |
| Average Volume | ~2.57 million |
| Trend | Short-term Bearish |
TV18 Share price BSE Performance
TV18 Broadcast also trades actively in the BSE and the prices there are the ones that are likely to be similar to those of the NSE since arbitrage exists. During previous sessions, the price of the stock was observed to be around ₹45.34, but the present price variation in the NSE is more aggressive. BSE has relatively low liquidity and NSE is the exchange of choice where real time price discovery is desired.
There are some slight variations in the intraday prices although the overall trend of the two exchanges is poor.
| Metric | Value |
| Exchange | BSE |
| Recent Price | ~₹45.34 (earlier session) |
| Liquidity | Moderate |
| Price Correlation | Closely aligned with NSE |
TV18 Share Price Chart and Technical View
Technical View and Share Price Chart.
The price trend of TV18 in the past year points to the volatility and drastic corrections. The shares are down sharply on the high of over ₹65 and are almost at its annual low. This indicates that the trend is highly negative and there is not much purchasing power in the higher levels. Technically, ₹36.79 is a major support level whereas resistance can be observed between ₹43-45. It would be needed to break out strongly above resistance to give a signal of trend reversal.
| Indicator | Level |
| 52-Week High | ₹65.29 |
| 52-Week Low | ₹36.79 |
| Key Support | ₹36–37 |
| Key Resistance | ₹43–45 |
TV18 Share Price Target (2025-2026)
Analyst forecasts in 2025 show a slightly optimistic future, provided there will be a turnaround in the advertising revenues and improved digital monetization. It is estimated monthly that it can appreciate over the course of the year, which will begin around the 50 levels and possibly end in 74.87 by December 2025. These targets are pegged mostly on the increase in operating margins and the stabilization of cash flows. Such projections can be optimistic without the basic recovery.
| Period | Target Price |
| Early 2025 | ₹50–52 |
| Mid 2025 | ~₹65 |
| End 2025 | ₹70–75 |
TV18 Share Price Target 2030 – Long-Term Vision
The 2030 long-term forecasts are ambitious and presuppose significant change in the business model of TV18. These estimates include the high rate of digital news usage, the enhancement of monetization, and the enhanced profitability profile. With the optimistic assumptions, the prices may shift to the range of ₹500-600 or above. But these are very speculative targets and based on long-term implementation, discipline of cost and a good industry environment.
| Scenario | Target Range |
| Conservative | ₹350–400 |
| Moderate Growth | ₹450–500 |
| Aggressive Bull Case | ₹600+ |
TV18 Share Price History and Long-Term Performance
Share Price History and Long-Term Performance.
Traditionally, the share price of TV18 has experienced several cycles, which follow the trends of advertising and the development of Network18 group closely. The stock was volatile as it fluctuated between 65.29 and 36.79 over the last one year. Although the value of the books increased with time, returns to the shareholders have been low because of low profitability.
Further rationale of investor hesitation and valuation discount is due to recent negative ROE of -0.45%.
| Metric | Value |
| 52-Week High | ₹65.29 |
| 52-Week Low | ₹36.79 |
| Long-Term Trend | Volatile |
| ROE (Recent) | -0.45% |
| Book Value | ₹99.9 |
TV18 Share price Quarterly Financial Performance
It is indicated in the quarterly results of TV18 Broadcast that the company experiences a high level of revenue shifting and variable profitability. Although, sales have shown a substantial growth in specific quarters because of the major events and election coverage, the operating margins have declined in the recent periods. The increase in the costs of operations and interest charges have strained the operating performance.
The last quarters have shown negative operating profit, which has pointed out to structural cost issues. Reported profits have been cushioned by other income at certain occasions concealing weakness in the core operations.
| Quarter | Sales | Operating Profit | Net Profit | OPM % |
| Jun 2023 | 3,176 | -54 | 91 | -2% |
| Sep 2023 | 1,794 | -198 | -65 | -11% |
| Dec 2023 | 1,676 | -146 | -56 | -9% |
| Mar 2024 | 2,330 | -161 | -137 | -7% |
| Jun 2024 | 3,069 | -109 | -120 | -4% |
TV18 Share price Annual Profit & Loss Analysis
OnTV18 has been increasing its revenue at a satisfactory rate in the long term annually. The profitability has not been steady though the recent years have recorded losses. Margins have been burdened by high content costs, employee expenses and finance costs.
Though the past years have indicated high profits in the peak advertisement periods, the current financial years indicate structural problems in the television news industry. Reliance on other income has been on a high.
| Year | Sales | Operating Profit | Net Profit |
| Mar 2021 | 4,498 | 808 | 746 |
| Mar 2022 | 5,526 | 1,038 | 926 |
| Mar 2023 | 5,912 | 193 | 128 |
| Mar 2024 | 8,976 | -559 | -167 |
| TTM | 8,869 | -614 | -378 |
TV18 Balance Sheet Overview
The balance sheet of TV18 Broadcast has also grown tremendously owing to an increase in reserves and other liabilities. During the past few years, borrowings have risen drastically, and thus, the increase in interest costs. Although the growth in assets indicates that it has invested in content and infrastructure, it is yet to be translated to better profitability. The increase in total assets and liabilities is very rapid, which implies significant restructuring and consolidation. Nonetheless, debt ratio is still a major issue of concern among investors.
| Particular | Mar 2024 |
|---|---|
| Equity Capital | 343 |
| Reserves | 16,786 |
| Borrowings | 6,214 |
| Total Liabilities | 39,894 |
| Fixed Assets | 14,845 |
| Total Assets | 39,894 |
TV18 Share price Cash Flow Analysis
The cash flow position of TV18 has been weak over the recent years. The negative cash flows were operating because of the losses and because the working capital requirements were increasing. Liquidity has also been strained by heavy investment activities, as well as finances change. The persistent downward currents in cash flow indicate the significance of cost management and reorganization of the operations. The increase in cash generation will continue to be a critical issue in the firm.
| Year | Operating CF | Investing CF | Financing CF |
| Mar 2022 | 593 | -293 | -293 |
| Mar 2023 | -2,718 | -706 | 3,317 |
| Mar 2024 | -6,378 | -5,138 | 1,018 |
TV18 Share Key Financial Ratios
The financial ratios of TV18 suggest poor metrics of returns. There has been a massive decrease in ROE and ROCE which indicates losses and wasted use of capital. The days of working capital have been rising drastically indicating inefficiencies in operations.
The stock has been trading below book value but the returns are low and this restricts the appeal of the stock to the long term value investor.
| Ratio | Value |
| ROE | -0.45% |
| ROCE | 0.12% |
| Working Capital Days | 424 |
| Interest Coverage | Low |
| Operating Margin | Negative |
TV18 Shareholding Pattern
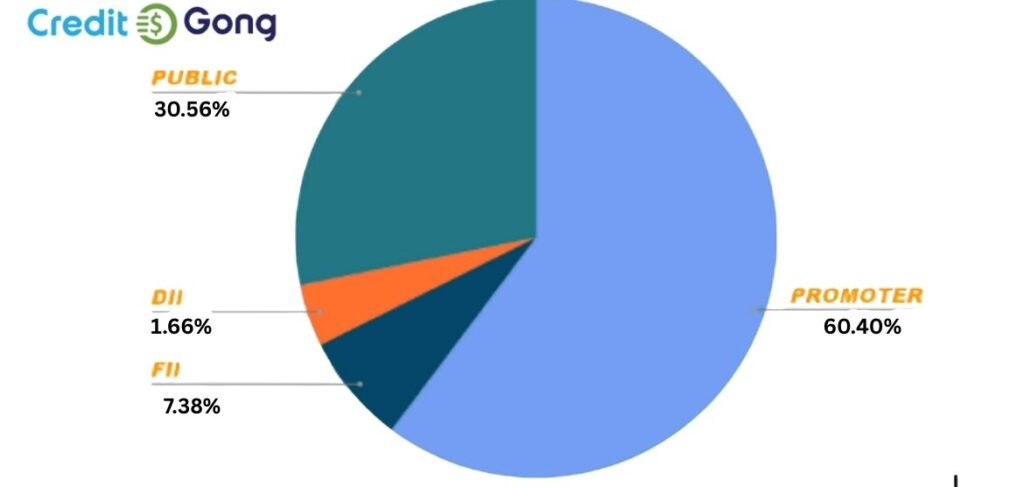
Promoters hold a stable holding of more than 60, which offers stability in terms of ownership. FII holdings have steadily reduced whereas public shareholding has gone up. Increasing retail participation suggests increasing speculative interest. The institutional level of engagement is low because earnings visibility is poor.
| Category | Holding % |
| Promoters | 60.40% |
| FIIs | 7.38% |
| DIIs | 1.66% |
| Public | 30.56% |
TV18 Share price Future Outlook
The future of TV18 Share price would rely on the cost rationalization, digital monetization and recovery of advertisements. Growth in online platforms and local content presents an opportunity to grow. Nevertheless, it is difficult to remain profitable in a competitive news environment. Structural changes, enhanced monetization strategies and stringent capital management will have to improve over the long term.
Conclusion
TV18 Broadcast Ltd occupies a very strong position in the news media market in India, being supported by the largest news network in the country and high brand perception in terms of television and internet platforms. Nonetheless, the company has had difficulties in its operations due to unabated losses, low operating margin, increasing borrowing, and declining cash flows over the last few years, even with an increasing revenue growth and high reach on its audience. Financial stability has also been affected by heavy reliance on advertising revenues and a high level of content and operation expenses. Investment wise TV18 can be described as more of a turn around story than a long-term consistent compounder currently.
FAQs
TV18 has news television and online news outlets in several languages in India.
In recent years, the company has recorded the loss although revenues have been on the rise.
No, TV18 does not at present pay dividends.
Valuations have remained low due to weak profitability, low returns and high cost.
It can be an appropriate choice of high risk investors that are betting on a turnaround, but the fundamentals are poor.