")
Taparia Tools Ltd is an Indian manufacturer of hand-tools that is among the oldest and most reputable known companies in the manufacturing of professional grade industrial tools applied in automotive, engineering, construction, and maintenance industries. Taparia Tools is a small market capitalization company that has received great interest among the investors because of the high dividend payout, constant profitability, and very low valuation ratios to other industrial joints. This article will provide complete information about Taparia Tools Share Price.
Taparia Tools Ltd Company Overview
Taparia Tools Ltd deals with manufacture and trade of hand tools in the form of spanners, pliers, screwdrivers, sockets, tool kits, and others that are commonly used as industrial tools by mechanics, technicians, and industrial operators. The company is an ISO-9001 organization and has, in the past, enjoyed technical partnership with Bahco Ltd, based in Sweden, and this has assisted the company in enhancing the quality of its products and manufacturing procedures.
Taparia Tools has built a powerful distribution network and a brand image within the country along with a reputation particularly in the field of professional and semi-professional tools. Taparia does not pursue aggressive growth but has a fairly simple model of manufacturing that involves efficiency, cost management and sustained demand unlike many capital-intensive work-intensive industrial companies. This structural conservativeness has enabled the company to have a high level of profitability and little debt with high cash flows.
| Company Particulars | Details |
| Company Name | Taparia Tools Ltd |
| Incorporated | 1969 |
| Industry | Industrial Products / Hand Tools |
| Certification | ISO-9001 |
| Collaboration | Bahco Ltd (Sweden) |
| Market Cap | ₹29.9 Cr |
| Current Price | ₹19.7 |
| Face Value | ₹10 |
| Dividend Yield | ~254% |
| ROCE | 47.9% |
| ROE | 35.6% |
Business Model and Operations
Taparia Tools is a manufacturing-based business with distribution and trading as its support system. The company produces a variety of hand tools that serve workshops, manufacturing plants, repair industries, and retail hardware industries. The demand of such products is likely to be stable since tools are not luxuries, but a constant industrial need. This company is not so much into fierce capacity growth but much on operational efficiency. The processes of production are standardized to ensure a consistent level of margins and product durability has assisted Taparia to have a consistent customer base spread across India. Mechanics and industrial technicians who value reliability over marketing attractiveness are the biggest consumers of the brand. Taparia has an advantage in domestic consumption unlike the biggest industrial firms which have to depend on export markets. This minimizes the currency risk but restricts fast growth possibilities. Nevertheless, fixed demand is a guarantee of certain revenue and cash flow.
| Business Segment | Description |
| Manufacturing | Hand tools production |
| Trading | Distribution through dealers |
| Key Products | Spanners, pliers, sockets, screwdrivers |
| Customer Base | Industrial users, mechanics, workshops |
| Market Focus | Primarily India |
| Revenue Nature | Stable industrial demand |
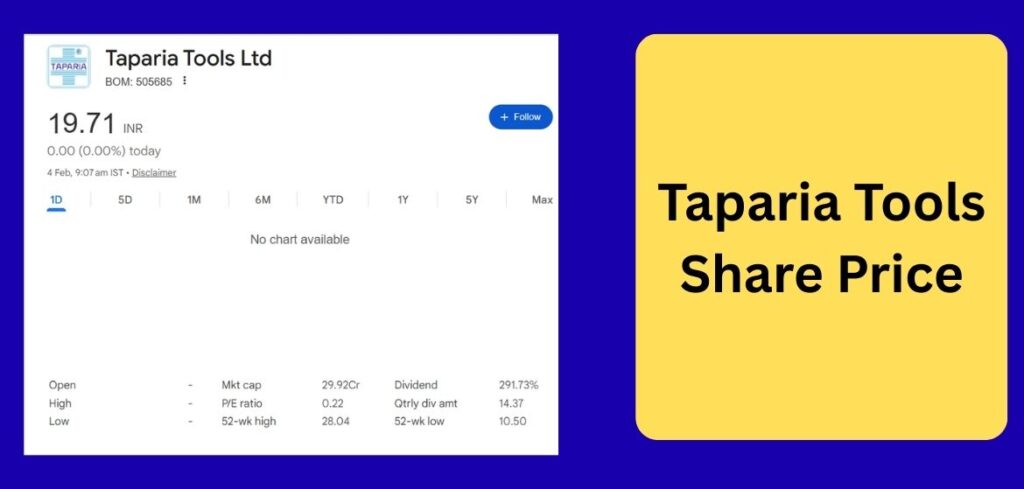
Taparia Tools Current Share Price
Taparia Tools Ltd is trading at present between ₹19 and 20 levels in the BSE, which represents a highly volatile but essentially good micro-cap stock. The most recent close of about 19.71 indicates a stable value having declined tremendously since it hit the 2025 high of 28.04. The market capitalization of the company is low at about 30crore and the trading volumes are extremely low with only a few stocks being traded in a session. It is an illiquid company, but with extraordinary financial ratios in the form of a very low P/E ratio of approximately 0.21, a price-to-book ratio of close to 0.07, high ROE of over 35 and zero debt operation. The stock has been giving colossal returns since previous lows of ₹4-5 yet the price changes are so sharp since a minor transaction can greatly affect the share price.
| Metric | Details |
| Current Price | ₹19.71 (approx.) |
| Market Cap | ₹30 Cr |
| 52-Week High | ₹28.04 |
| 52-Week Low | ₹4.48 |
| P/E Ratio | 0.21 |
| Price to Book | 0.07× |
| ROE | 35.6% |
| Trading Volume | Very Low |
Taparia Tools BSE Price Details
Taparia Tools is listed on the Bombay Stock Exchange with a code 505685, and nearly all liquidity is available. The stock has limited daily ranges regularly since the trading activity is low. In other sessions, the same open, high, low and close prices are registered which underlines illiquidity and not price stability. Valuation indicators are still appealing even when there is a low level of trading, with the stock trading approximately 269 less than the book value of about 239 per share. The large operating margins and return ratios are favorable to the interest of the investors but few investors are involved to allow efficient price discovery.
| BSE Information | Details |
| Exchange | BSE |
| Script Code | 505685 |
| Latest Close | ₹19.71 |
| 52-Week Range | ₹10.5 – ₹28 |
| Book Value | ₹269 |
| ROCE | ~48% |
| Operating Margin | ~17% |
| Liquidity | Very Thin |
Taparia Tools NSE Listing Status
Despite the fact that Taparia Tools does have an NSE symbol, it does not trade in large volumes on the National Stock Exchange. The investors are mostly using BSE quotes due to its almost zero volumes in NSE.
| Listing Status | Details |
| NSE Symbol | TAPARIA TOOL |
| NSE Volume | Negligible |
| Primary Trading Exchange | BSE |
| Price Discovery | BSE Driven |
| Investor Tracking | BSE Quotes Preferred |
Taparia Tools Share Price History
Taparia Tools price movement has been characterized by an exceptional volatility that is due to corporate activities, low float and low trading volume. The stock was trading at approximately 2-3 ranges in 2023 and then started soaring in 2024 and 2025. The prices were rising slowly by slowly through ₹16, ₹20, and finally reaching high near ₹28 in July 2025. This was corrected and the stock started to move again towards ₹11– 20. Bonus or split adjustments are adjusted in the prices, so it is possible to see out of the blue losses in the charts. The long-term investors have been experiencing considerable returns even with the abrupt interim fluctuations.
| Date | Close (₹) | Adjusted Close (₹) | Volume |
| Feb 27, 2025 | 16.43 | 1.78 | Very Low |
| Jun 9, 2025 | 20.95 | 2.27 | 1,000 |
| Jul 24, 2025 | 28.04 | 3.04 | 700 |
| Aug 11, 2025 | 11.57 | 11.57 | 2 |
Taparia Tools Share Price Chart Analysis
The chart analysis shows that there is an upward trend in the long term starting the year 2023 and then a consolidation after the peak of the year 2025. The stock has a good support around ₹10 -12 level and the resistance is near 28. The traditional technical analysis is not very reliable because of very low volumes being traded. Price spikes usually come out of a significant lack of news flow, which are caused by the mismatch between supply and demand but not by institutional purchasing. Dividend payouts are also high and this has an effect on investor behavior since most shareholders do not trade but hold their dividends.
| Technical Indicator | Observation |
| Long-Term Trend | Uptrend since 2023 |
| Major Support | ₹10–12 |
| Resistance | ₹28 |
| Volume Pattern | Irregular spikes |
| Chart Reliability | Limited due to illiquidity |
Taparia Tools Share Price Target 2026–2030
Long term estimates presuppose the progressive increase in operations and the profitability. Analysts predict that the constant increase in revenues of approximately 10 percent a year and the subsequent growth in profits will push the prices to the upsurge in the long run. These are however speculative projections since micro-cap stocks are very sensitive to market participation.
| Year | Min Target (₹) | Max Target (₹) |
| 2026 | 30 | 40 |
| 2029 | 75 | 90 |
| 2030 | 95 | 115 |
Taparia Tools Financial Performance
Taparia Tools has been able to provide stable financial growth during the past decade. Its revenue has increased slowly with an initial figure of approximately 266 crore to an almost 1000 crore trailing. The operating margins of the company have been increasing and this indicates efficiency and cost control.
The growth of profits has been exceptional in nature especially due to the restrained cost management and the low costs of borrowing. Net profits have been on an upward trend enabling the company to create a high growth of earnings per share. Operational maturity is reflected in the operational margin that the firm had been at single digits in the past but now it is almost 18 percent.
| Financial Metric | Earlier Period | Recent Period |
| Sales | ₹266 Cr | ₹1,000 Cr (TTM) |
| Operating Profit | ₹20 Cr | ₹182 Cr |
| Net Profit | ₹12 Cr | ₹144 Cr |
| Operating Margin | 7% | 18% |
| Profit Growth (5Y CAGR) | — | 32% |
| EPS Growth | Strong upward trend | Continued improvement |
Taparia Tools Share Price Quarterly Performance
The quarterly performance has been stable with regard to revenue growth coupled with an increase in profitability. The sales are steady on quarterly basis and it means that there are predictable business demand. The operating profit margins have improved progressively because of the suppressed costs and effective production.
The Net profit is also high with the interest costs being minimal as the company has almost no debt. The stability of earnings has helped the stock to attract the attention of investors.
| Quarter | Sales (₹ Cr) | Net Profit (₹ Cr) | OPM % |
| Dec 2024 | 235 | 31 | 16% |
| Mar 2025 | 243 | 31 | 17% |
| Jun 2025 | 242 | 35 | 18% |
| Sep 2025 | 259 | 41 | 20% |
| Dec 2025 | 256 | 38 | 18% |
Taparia Tools Ltd Profit and Loss Trend
The long-term profit and loss data reflect a change of the smaller profitability rates to the high growth in earnings. The growth of revenues has been of a steady, as opposed to explosive nature, whereas there has been an acceleration in the growth in profits courtesy of margin growth.
Operating leverage is important in this case as when the fixed costs became stabilized, incremental revenue was directly converted to increased profits.
| Year | Sales (₹ Cr) | Net Profit (₹ Cr) | OPM % |
| FY2018 | 405 | 15 | 5% |
| FY2020 | 472 | 31 | 8% |
| FY2022 | 668 | 65 | 13% |
| FY2024 | 829 | 100 | 15% |
| FY2025 | 913 | 123 | 17% |
| TTM | 1,000 | 144 | 18% |
Taparia Tools Ltd Balance Sheet Strength
Taparia Tools has a very good balance sheet and has minimal borrowings. Reserves have been increasing with time, with the accumulation of retained earnings and profits. The firm operates with a conservative financial policy that mitigates the risk in case of an economic crisis. Low leverage also allows the management to pay out high dividends without any financial strain.
| Balance Sheet Item | Recent Value |
| Equity Capital | ₹15 Cr |
| Reserves | ₹393 Cr |
| Borrowings | Near zero |
| Total Assets | ₹491 Cr |
| Fixed Assets | ₹25 Cr |
| Investments | ₹188 Cr |
Taparia Tools Ltd Cash Flow Analysis
The cash flows indicate good operating cash generation. The firm has generated positive operating cash flow regularly and the financing cash flows are mostly negative as a result of paying dividends. The activity of investment represents slow growth and investments.
| Cash Flow Type | Trend |
| Operating Cash Flow | Strong positive |
| Investing Cash Flow | Moderate outflow |
| Financing Cash Flow | Dividend payouts |
| Net Cash Flow | Stable |
Taparia Tools Ltd Key Financial Ratios
Taparia Tools is a company that can be distinguished by very high profitability ratios and very low valuation indicators. Return on Capital and ROE are high and this implies that it is using its capital efficiently.
| Ratio | Value |
| ROCE | 47.9% |
| ROE | 35.6% |
| P/E Ratio | 0.21 |
| Price to Book | 0.07× |
| Dividend Yield | 254% |
| Debt Level | Minimal |
Taparia Tools Ltd Dividend Policy
Another aspect of Taparia Tools that has been talked about most is its impressive dividend payout. The company pays a substantial amount of profits to stockholders, which makes the dividend yield unusually high. This has seen the popularity of the stock among income oriented investors. To a degree, however, such high yields are due to the very low share price in comparison to dividend distribution.
| Dividend Metric | Details |
| Dividend Payout Ratio | ~62% |
| Dividend Yield | ~254% |
| Dividend History | Consistent payouts |
| Strategy | Profit sharing with shareholders |
Taparia Tools Ltd Shareholding Pattern
The ownership of the promoters is still high and this shows that the management is confident in the business. There is a gradual decrease in public shareholding with promoters having recorded a slight increase in the shareholding in the last few quarters.
| Shareholder Category | Holding |
| Promoters | 71.53% |
| Public | 28.46% |
| Number of Shareholders | 1,553 |
Taparia Tools Competitive Position
Taparia Tools is at a significantly smaller scale of operation as compared to its large industrial counterparts but offers much better profitability ratios. It has a niche positioning, and its cost discipline gives it an opportunity to compete with minimal marketing spending.
| Company | ROCE | Market Cap |
| APL Apollo | 22% | Large Cap |
| Welspun Corp | 21% | Large Cap |
| Ratnamani Metals | 21% | Large Cap |
| Taparia Tools | 47.9% | Micro Cap |
Taparia Tools Ltd Growth Outlook
Taparia Tools is likely to have a steady but not aggressive growth in the future. The company can take advantage of increased infrastructure activity, automotive maintenance demand and industrialization in India. but scale constraints and little exposure to export might inhibit a fast increase in revenues. It is expected to grow slowly by improving its efficiency and sustained domestic demand instead of substantial capital investments.
| Growth Driver | Impact |
| Industrial demand | Stable revenue |
| Infrastructure growth | Tool usage increase |
| Brand loyalty | Repeat customers |
| Low debt | Financial flexibility |
Risks and Challenges
The company is exposed to some risks in spite of its good fundamentals. Liquidity is low in the stock market due to its small size hence volatility in the prices. Valuation expansion is also limited due to limited institutional participation and reliance on local markets.
| Risk Factor | Explanation |
| Low liquidity | Thin trading volumes |
| Small market cap | Higher volatility |
| Limited exports | Growth constraints |
| Concentrated business | Industry dependency |
Conclusion
Taparia Tools Ltd is one of the few examples of the Indian stock market where a micro-cap firm has a very high profitability alongside very low valuation parameters. The disciplined management, zero debt balance sheet and steady dividend payments by the company has formed an unusual profile in investments that is income oriented and not growth oriented. Although it is too small and illiquid, the company remains highly efficient in its operations and has shown friendliness towards its shareholders. Taparia Tools is a peculiar and yet, interesting industrial share to the long-term investors in need of stable cash-producing businesses with high dividend outlay.
FAQs
The company produces hand tools like spanners, pliers, screwdrivers, sockets and industrial tool kits.
It has a reputation of very high dividend payouts and low valuation ratios.
Yes, the business has low borrowings and balance sheet.
It is largely viewed as an income oriented stock because of high dividends as compared to vigorous growth.
Read More
How House Fire Solutions’ Post-Fire Recovery Checklist Simplifies the Restoration Process