")
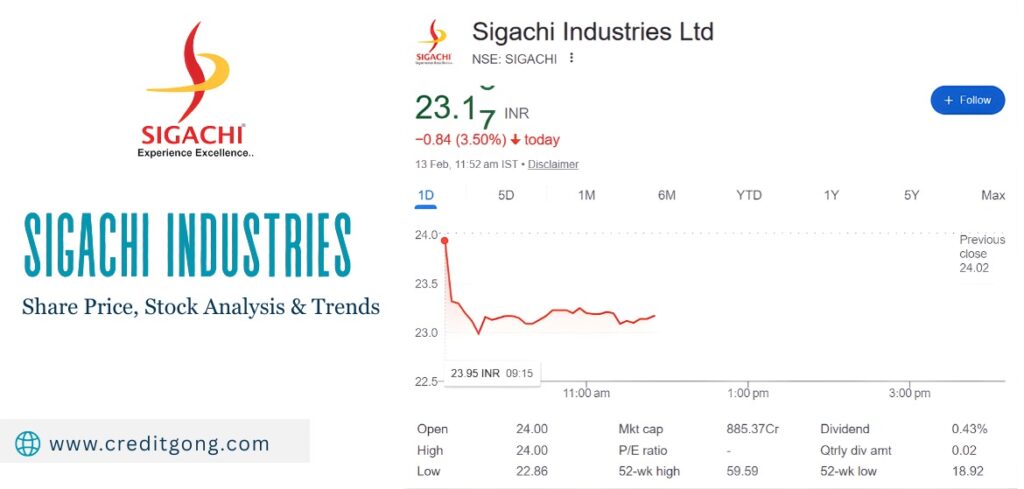
Sigachi Industries Share Price (12 Feb 2026) – They were trading at ₹24.16 a share, which is a loss of roughly 2.43% as of the most recent update on the 12th of February, 2026. Other recent data from the platforms shows them trading at approximately ₹24.0 on the NSE/BSE.
Sigachi Industries Limited has a segment of the pharmaceutical and allied industries business that is specialised but crucial, which is the cellulose-based excipients used mostly as Microcrystalline Cellulose (MCC). Excipient manufacturers such as Signachi have an important subsidiary role though they have not received the publicity that formulation companies receive because they guarantee drug stability, consistency, and manufacturability.
Sigachi has demonstrated consistent growth in business in the recent years, yet the share price has been highly volatile and correcting over an extended variety of time.
This article will provide complete information about Sigachi Industries Share Price, market trends, Financials Targets & Risks (2026-2030).
Sigachi Industries (SIGC): Company Overview
Sigachi Industries limited is a company incorporated in 1989 and mainly involved in the production and sale of Microcrystalline Cellulose (MCC).
MCC is a popular pharmaceutical excipient which can be employed as a binder, filler, and disintegrant in tablets and capsules. It has built up considerable technical competence in the area of cellulose processing and now provides more than 60 different grades of MCC, with a particle size of 15 microns to 250 microns, and is able to serve a wide range of pharmaceutical formulations.
Besides pharmaceutical excipients, Sigachi has struck business operations in active pharmaceutical ingredients (APIs), intermediates, vitamin-mineral blends, polymer blends, food and nutrition products and operations and management services. Nonetheless, MCC remains the main source of revenue and profits, and the company is still vulnerable to the changes in the demand in the manufacturing and formulation of pharmaceuticals.
Sigachi share price were at ₹26.1 a day later, 10 February, 2026 which is equivalent to a market capitalization of about ₹997 crore.
| Aspects | Details |
| Company Name | Sigachi Industries Limited |
| Incorporated | 1989 |
| Core Business | Microcrystalline Cellulose (MCC) |
| Current Share Price | ₹26.1 |
| Market Capitalisation | ₹997 Cr |
| Face Value | ₹1 |
Sigachi Industries Ltd Business Model and Product Portfolio
The business model of Sigachi is initiated on the principle of volume based manufacturing in terms of consistency in quality. As opposed to branded pharmaceutical formulations, excipients are more of a commoditised product, success hinged on the efficiency of processes, scale, compliance with regulations and long-term relationships with customers. The influences of pricing are low and this puts a strain on cost management and asset utilisation. The fact that the company produces MCC in various grades enables the company to fulfill the needs of customers with varying compression, flow and dissolution needs. This flexibility gives some competitive edge but they do not protect margins completely in times of inflation of raw materials or low demand. There are optional growth opportunities in diversification into APIs, blends and food-grade products, which are smaller segments at present than MCC.
| Segment | Description |
| Pharmaceutical Excipients | MCC (primary business) |
| APIs & Intermediates | Limited scale |
| Vitamin–Mineral Blends | Nutraceutical applications |
| Polymer Blends | Industrial use |
| Food & Nutrition | Non-pharma exposure |
| O&M Services | Ancillary |
Sigachi Industries Market Position and Peer Context
Sigachi is in a niche sub-segment because it is in the bigger pharmaceutical and biotechnology ecosystem, but its niche business is the excipients. Sigachi is significantly smaller in terms of size compared to large pharmaceutical formulation companies and has a lower margin and ratios of returns, although it also has a lower risk of regulatory consequences, when it comes to drug approvals.
As a small company, with low growth visibility and poor return profile, Peer comparison emphasizes that Sigachi trades at a lower valuation multiple than large pharma companies. Its ROCE is, however, generally consistent with the sector median, indicating that its operations are relatively efficient to its scale.
| Company | CMP (₹) | P/E | Market Cap (₹ Cr) | ROCE |
| Sun Pharma | 1707.8 | 33.8 | 4,09,758 | 20.2% |
| Divi’s Labs | 6175.5 | 65.9 | 1,63,862 | 20.4% |
| Cipla | 1342.1 | 22.8 | 1,08,416 | 22.7% |
| Sigachi Industries | 26.1 | 16.4 | 997 | 15.5% |
Sigachi Share Price Performance and Volatility
The Sigachi Industries Share Price has been experiencing harsh rectification in the last one year. Sigachi Share Price had gone down to 18.9, a low of 52 weeks, but it has been stabilising at present levels. This is a decline of more than 55 percent of the peak levels. The one year performance of -35 percent is associated with negative long-run sentiment, which is caused by margin volatility, selling of stocks by the promoters, and the fear of the consistency of earnings as opposed to a breakdown of revenue.
| Parameter | Price (in ₹) |
| Current Share Price | 26.1 |
| 52-Week High | 59.6 |
| 52-Week Low | 18.9 |
| 1-Year Return | −35% |
Sigachi Industry IPO
The IPO of Tiny Pharma took place in November 2021 and was aimed at increasing the production of pharmaceutical-grade MCC. The stock has been trading at a high price at 163 per share, but it has since lost a huge chunk of its worth in irregular execution and negative dynamics.
| IPO Detail | Information |
| IPO Open | November 2021 |
| Issue Price | ₹163 |
| Issue Size | ₹125.43 crore |
| Lot Size | 90 shares |
| Listing Date | 15 November 2021 |
| IPO Objective | MCC manufacturing expansion |
Sigachi Share 52-Week High & Low
The 52 week highest of ₹59.59 (June 2025) of the stock is in stark contrast with the recent lows. The constant downward movements have been pushing the price near long-term support areas, and this indicates long-term under performance in comparison with the wider indices.
| Metric | Price |
| 52-Week High | ₹59.59 |
| 52-Week Low | ₹18.92 |
| Current vs High | ~56% lower |
Sigachi Share Price and Stock Value Trends
Sigachi started off well after being listed at 163 but did not manage to maintain the momentum. The highest stock value was attained in February 2024, 95.90 and since then in a long-term backlash. Even aggressive surges in 2025 did not last long, and prices soon went back to the ₹25-30 range.
| Period | Performance |
| IPO Price (2021) | ₹163 |
| All-Time High | ₹95.90 (Feb 2024) |
| 1-Year Change | -35% to -49% |
| Current Trend | Downtrend |
Reasons for Sigachi Share Price Decline
The biggest one was the explosive incident at the Pashamylaram factory in June 2025, which stopped the production and caused regulatory measures. This was succeeded by poor quarterly performances, dwindling sales, decreasing profits and the fears regarding promoter shares pledging all of which undermined investor interest.
| Factor | Impact |
| Factory Explosion | Production halted |
| Regulatory Probe | NGT involvement |
| Q2 FY26 Profit | ↓ 50.92% YoY |
| Revenue | ↓ 11.55% |
| EPS | Weak / Negative |
| Promoter Pledging | Sentiment negative |
Sigachi Share Price Targets (2026-2030)
The price targets that can be found online are highly varied and need to be approached with care. The short- to medium-term forecasts indicate a narrow growth in the future unless the fundamentals are better. Very high long-term projections are very speculative, and are made on speculative assumptions instead of the present performances.
| Year | Low Target (₹) | High Target (₹) |
| 2025 | 19.8 | 41.8 |
| 2026 | 41.8 | 43.5 |
| 2027 | 43.5 | 45.7 |
| 2030* | 295 | 59,478 |
*Highly speculative, assumption-based projections.
Sigachi Share Valuation Analysis
Sigachi Industries has a P/E ratio of 16.4 at the current price which is lower than the median in the pharmaceutical industry. This price implies low growth forecasts reflected in the stock. At the book value of 13.3s the stock is trading at about 2x book which is not distressed or aggressive.
It has a low dividend of 0.38 and its yield is 0.38 implying that it has partially repaid the shareholders despite its current expansion requirements.
| Metric | Value |
| P/E Ratio | 16.4 |
| Book Value | ₹13.3 |
| Dividend Yield | 0.38% |
| Market Cap | ₹997 Cr |
Sigachi Industry Revenue and Profit Growth Trend
Sigachi has shown a long term growth of revenue. The sales grew by 50 percent (FY25) as compared to the past (FY18) by 50 percent; TTM revenue stood at 506 crore. Until recently the growth in profits was observed to follow the growth in revenue. The 8 percent loss in TTM profits is however something to get worried about, and it shows stress on the margins or the cost structure. This deceleration of the growth rate in earnings is among the main causes of poor performance of the stock.
| Metric | CAGR |
| Sales Growth (5Y) | 29% |
| Sales Growth (3Y) | 25% |
| Profit Growth (5Y) | 28% |
| Profit Growth (3Y) | 20% |
| TTM Profit Growth | −8% |
Quarterly Performance Analysis
There is high volatility in quarterly performance. Even though there was no change in the sales growth, fluctuations in the profitability occurred as a result of variations in the operating margins, other revenue and costs. June 2025 quarter showed a net loss which was mostly because of unusual elements, and then a low operating margin of 7 percent in September, 2025. The next findings planned to be made on 14 February 2026 will be strictly observed to determine whether there will be signs of stabilisation.
| Quarter | Sales (₹ Cr) | Net Profit (₹ Cr) | OPM |
| Mar 2025 | 128 | 16 | 22% |
| Jun 2025 | 128 | -101 | 19% |
| Sep 2025 | 110 | 11 | 7% |
Margin Analysis
Historically, Sigachi used to have operating margins of 1822, which is good as an exceptional manufacturer. Nevertheless, the current narrowing of the margin indicates an increase in the cost of raw materials, inefficiency in operations, or a decrease in prices. The recovery of investor confidence requires continued recovery in margins.
| Year | OPM |
| FY18 | 12% |
| FY21 | 20% |
| FY23 | 19% |
| FY25 | 20% |
| TTM | 18% |
Balance Sheet Strength
The balance sheet of Sigachi indicates an average leverage. The borrowing has risen to finance the increase in capacity and the fixed assets have grown significantly in the recent few years. Increasing working capital requirements have enhanced intensity in the balance sheets.
| Item | ₹ Cr |
| Total Assets | 846 |
| Reserves | 563 |
| Borrowings | 142 |
| Fixed Assets | 370 |
| CWIP | 9 |
Cash Flow Analysis
The cash flow of the operations has been positive, which is a structural strength. Nevertheless, high capital spending has led to negative free cash flow within a number of years. Cash flow financing has been used to fund expansion and dividend dividend payout.
| Year | CFO | CFI | CFF |
| FY23 | 29 | -92 | 26 |
| FY24 | 13 | -161 | 172 |
| FY25 | 27 | -93 | 81 |
Working Capital Efficiency
The working capital efficiency has declined significantly. Cash conversion cycle was raised to 234 days due to the rise in inventory and receivables. This ties funds and makes it dependent on external capital.
| Metric | Days |
| Debtor Days | 137 |
| Inventory Days | 155 |
| Payable Days | 59 |
| Cash Conversion Cycle | 234 |
Sigachi Industry Return Ratios
The ratio of returns has decreased over the years as capital used has been growing at a higher rate than profit. ROCE has dropped to 15.5 percent as compared to 44 percent in previous years whereas the ROE has been maintained at 11-percent on average in the past three years.
| Metric | Value |
| ROCE | 15.5% |
| ROE (3Y Avg) | ~11% |
| Trend | Declining |
Sigachi Industry Shareholding Pattern Analysis
The holding by the promoters has decreased steadily, it was 48.49% in March 2023 and dropped to 39.70% in December 2025. More to the point, 40.3 percent of promotion holding is pledged meaning that it poses a great risk of financial risk. Increasing public ownership signifies distributions and not concentrations.
| Category | Holding |
| Promoters | 39.70% |
| FIIs | 3.33% |
| Public | 56.97% |
| Shareholders | 1.95 lakh |
Conclusion
Sigachi Industry is an excipient niche manufacturer with a consistent stable core business, but an escalating structural challenges. Although the growth in revenues has not been affected and the operating cash flows have been positive, the margins have been falling, promoting selling, high level of pledges, and poor growth in profits have taken its toll on investor confidence. The present valuation is based on prudence more than expectations. Even the recovery of the margin, the cut in promoter pledge and the stabilisation of the earnings will be necessary to make any significant rerating.
FAQs
Sigachi is a producer of Microcrystalline Cellulose (MCC) which is a significant pharmaceutical excipient in pills and capsules.
The cause of the fall is margin volatility, diminishing promoter holding, high promoter pledging and recent slowdown on profits.
Yes the company is normally profitable, however recent quarters had earnings volatility including one loss making quarter.
Yes, Sigachi is paying a low dividend with a yield of approximately 0.38.
The key threats are weak working capital cycle, promoter pledge, margin pressure, and low pricing power.